The velocity ()–time () plot of the motion of a body is shown below. The acceleration ()–time () graph that best suits this motion is:
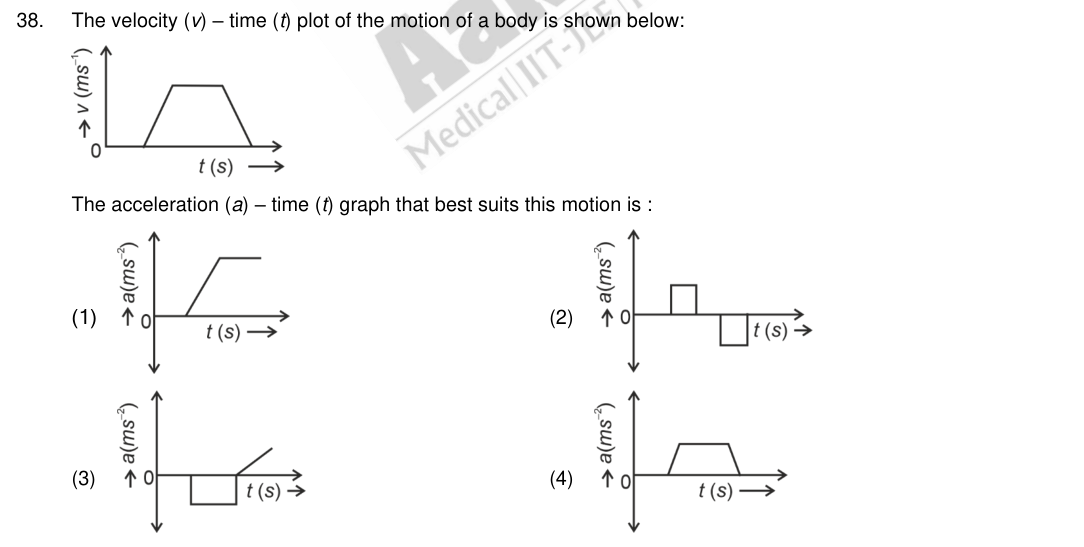
The velocity ()–time () plot of the motion of a body is shown below. The acceleration ()–time () graph that best suits this motion is:
Solution
The velocity rises linearly (constant positive acceleration), stays constant (zero acceleration), then falls linearly (constant negative acceleration). The – graph is therefore a positive rectangle, zero, then a negative rectangle — graph (2).
From Physics › Motion in a Straight Line › Displacement, velocity, acceleration; graphs — lectures, notes and every past question on it.
Last revised . Found a mistake? Tell us — corrections are the fastest thing we act on.